Hi, I'm Manikya Kolekar
Implementation Engineer
Building automated solutions with Python, SQL, and SaaS systems to drive business efficiency. Specializing in SAP integration, workflow automation, and master data management.

Building automated solutions with Python, SQL, and SaaS systems to drive business efficiency. Specializing in SAP integration, workflow automation, and master data management.
I'm an Implementation Engineer & Data Automation Specialist with expertise in Python, SQL, SAP integration, and workflow automation. Currently implementing enterprise systems at Zino Technologies while leveraging data analytics to optimize business processes.
Years Experience
Manual Effort Reduced
Days to 3 Hours (Workflow Optimization)
Platform Adoption Improved
Python, SQL, HTML/CSS, JavaScript
Power BI, DAX, Power Query, Excel, Tableau
REST APIs, Data Pipelines, Workflow Automation, SAP
Pandas, NumPy, Postman, Git, MySQL, PostgreSQL
SaaS Implementation, Master Data Management, ETL, Client Onboarding
Agile, UAT Coordination, Production Support
Tech Stack: Python, SQL, REST APIs, SAP
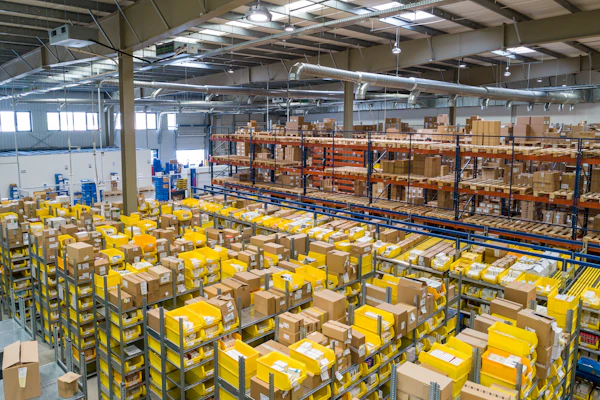
Implemented and automated enterprise warehouse master data workflows for a large-scale supply chain system. Introduced DigiPIN-based location identification to uniquely and accurately map warehouse addresses. Re-engineered manual validation and approval workflows using Python and SQL-based automation, reducing warehouse creation turnaround time from 30-35 days to under 3 hours.

Tech Stack: Workflow Automation, Dashboards, SaaS Configuration
Implemented a web-based mentoring platform with role-based access and automated workflows. Automated onboarding, notifications, session tracking, and feedback capture. Designed dashboards to monitor mentor-mentee engagement and platform usage, improving platform adoption and engagement by 25%.

Tech Stack: Python, SQL, Power BI
Designed and implemented automated dashboards using Power BI to track operational KPIs. Built data pipelines using Python and SQL for data transformation and system integration. Automated recurring workflows, reducing manual operational effort by 15%.

Tech Stack: Power BI, DAX, Power Query
Developed interactive Power BI dashboards to analyze sales performance by region and category. Created DAX measures for KPIs including revenue, margins, and growth. Cleaned and transformed datasets using Power Query and calculated columns for enhanced data visualization.